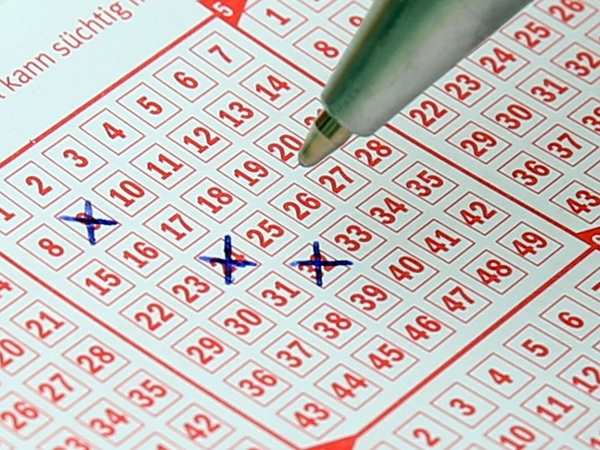
LAS VEGAS—As the Powerball jackpot swells to an estimated $526 million, a new analysis from Vegas Insider has identified the most frequently drawn numbers in the lottery’s history.
According to an analysis of every Powerball draw since 1997, the number 20 has appeared more than any other, with a frequency of 391 times. It is followed by number 23, which has been drawn 371 times, and number 14, with 370 appearances.
The analysis, which also examined Mega Millions data since 2010, found that the number 11 is the most frequently drawn Mega Millions ball, appearing 216 times. The numbers 10 and 3 were also among the most common.
While the data provides an interesting look at lottery history, Vegas Insider emphasized that these statistics are not predictions. The odds of winning the lottery remain the same for every draw, regardless of past results.
The analysis also provided a “best possible ticket” based purely on the frequency of individual ball positions. For Powerball, this included the numbers 1, 15, 26, 39, and 49, with the Powerball being 20. For Mega Millions, the suggested numbers were 15, 3, 31, 46, and 66, with the Mega Ball being 9.
Here are the ten most frequently drawn numbers in Powerball history:
| Rank | Number | Overall Frequency |
| 1 | 20 | 391 |
| 2 | 23 | 371 |
| 3 | 14 | 370 |
| 4 | 2 | 364 |
| 5 | 21 | 363 |
| 6 | 19 | 361 |
| =7 | 5 | 358 |
| =7 | 9 | 358 |
| =7 | 12 | 358 |
| =7 | 16 | 358 |
Here’s a look at the ten luckiest numbers in Mega Millions:
| Rank | Number | Overall Frequency |
| 1 | 11 | 216 |
| 2 | 10 | 215 |
| 3 | 3 | 211 |
| =4 | 4 | 196 |
| =4 | 14 | 196 |
| =6 | 9 | 194 |
| =6 | 20 | 194 |
| 8 | 15 | 193 |
| 9 | 2 | 192 |
| 10 | 6 | 190 |
The findings are based on data from official lottery websites, with the analysis correct as of July 7, 2025.
Photo via Pixabay


